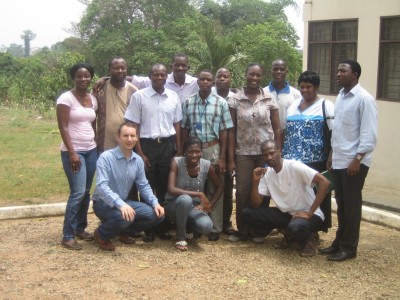
Course on ‘Advanced Geo-spatial Analysis’, course module CCLU 725, as part of the WASCAL Graduate Research Program on Climate Change and Land Use
Remote sensing is an important tool for the analysis of land cover and land use dynamics. Land use and land cover dynamics variables are used within climate and crop models as key information data sets. Land use and land cover pathways can be used to explain climate change effects and anthropogenic trends. From this understanding predictive scenarios regarding climate change effects on cropland dynamics, and visa-versa, can be developed. The ‘Advanced Remote Sensing’ course enhances the students understanding of mapping and analyzing land surface dynamics using innovative approaches in satellite remote sensing. These approaches are deemed to be relevant to the research agendas of the students.
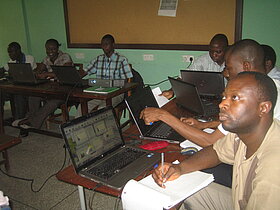
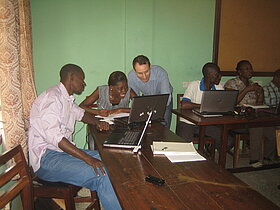
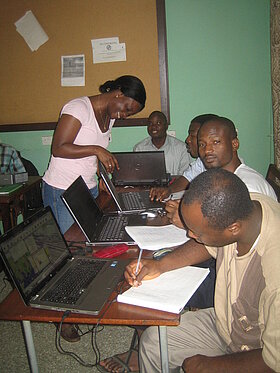
Software packages such as Erdas Imagine, ENVI, and TiSeG are used to help the students to familiar themselves with the data and this new technology.
The course was facilitated by the Remote Sensing Department of the University of Wurzburg; the lecturers were Dr. Tobias Landmann and Dr. Noellie Rüth. The course outline is seen below.
Outline of the Course
Part 1: Introduction to Remote Sensing
- Theoretical part: Basics of Remote Sensing (RS)
- Definition of Remote Sensing
- Why Remote Sensing?
- Geometric resolutions
- Spectral signatures
- Data handling; raster data
- How/where to get satellites images
- Satellite systems
- Practical part: Data acquisition
- Where to get RS data?
- Data extraction
- Introduction to the ERDAS Imagine software
Part 2: Image analysis
- Theoretical part: Atmospheric correction and classification I
- Atmospheric correction
- Introduction to basic classification principles
- Practical part: Viewing image data, spectral enhancement, spectral profiles, Spectral Angle Mapper (ENVI)
- Introduction to the ENVI software
- Visual analysis of satellite images and different bands
- Comparison of corrected versus uncorrected spectra
- Atmospheric correction in ENVI
- Spectral profiling
- Principal component analysis (PCA)
- Image classifications using Spectral Angle Mapper (SAM)
Part 3: Classification II
- Theoretical part: Unsupervised classification
- Definition of unsupervised classification
- Applications and limits
- Clustering
- K-Means Algorithm
- ISODATA
- Practical part: Land cover mapping
- Unsupervised classification with ERDAS Imagine and ENVI
- Classification problems
- Signature editor
- Histogram plots
- Feature spaces
- Feature objects
- Statistic analysis
Part 4: Classification III
- Theoretical part: Supervised classification, accuracy assessment
- Definition of supervised classification
- Sampling strategies
- Training data – from ground truth data
- Training data – from satellite data
- Class and feature space analysis
- Class separability
- Accuracy assessment
- Practical part: Land cover mapping
- Classification methods with ERDAS and ENVI
- Training data
- Image alarm
- Statistics
- Signature mean plots
- Histograms
- Signature separability
- Contingency matrix
- Supervised classification
- Accuracy assessment
Part 5: Change detection
- Theoretical part: Detection and quantification of Land Use / Cover Change (LUCC) in Africa
- Detection and quantification of Land Cover/Land Use Change
- Importance and key issues in Land Cover/Land Use Change mapping
- A LUCC mapping mechanism for the GLOWA Volta basin in West Africa and LUCC mapping in East Africa
- Practical part: deriving LUCC for Carbon stock assessments
- Deriving a change matrix
- Calculation of the net Carbon loss from deforestation using LUCC data
Part 6: Timesat and TiSeG
- Theoretical part: Wetland mapping, Vegetation Index (NDVI)
- Wetland mapping and introduction to the TiSeG software
- Utility of MODIS time-series data to map wetlands
- Wetland mapping workflow/methodology
- Definition of the Vegetation Index (NDVI)
- NDVI calculations based on different satellite sensors
- An example of chlorophyll activity in vegetation
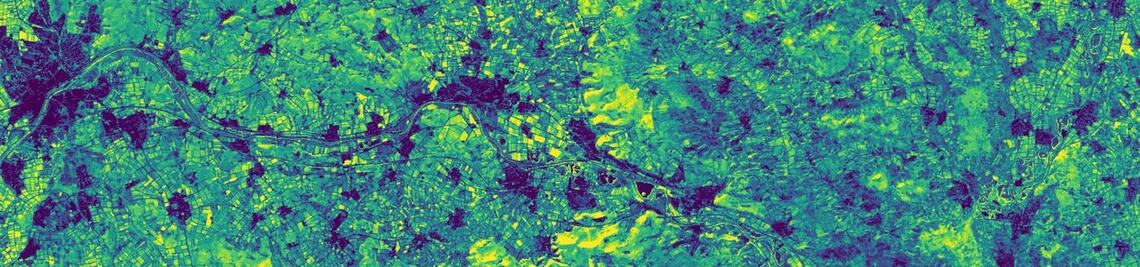
- An example of the NDVI variability in West Africa
- Practical part: Processing of MODIS data
- TiSeG installations
- Correction of MODIS data for clouds, cloud shadows, aerosols and BRDF effects
- Wetland mapping using the index funtions in ERDAS Imagine
- NDVI calculation with ERDAS Imagine (an example using Landsat data)
Part 7: Fire monitoring
- Theoretical part: Fire detection and burned area mapping
- Definition of bushfire
- Fire detection with MODIS
- Spectral signatures of burned area
- Definition of the Normalized Burn Ratio Index according to different satellite sensors
- Definitions and methods used in burn severity mapping
- Practical part: Pre-processing and using the Normalized Burn Ratio index (NBR), burn severity mapping
- Active fire mapping
- Calculation of the NBR index for the Pendjari National Park
- Computing burn severity
Part 8: Tutorial and map presentations
Part 9: Exam